FAANGM (Facebook, Amazon, Apple, Netflix, Google and Microsoft) are the new darling of the market and explain why there is such a discrepancy between the market and the general economy.
Luckily for us Yardeni has compiled a great book of data on the subject. FAANGM stocks are now 24% of the S&P 500 market cap something that increased during the Covid-19 crisis.
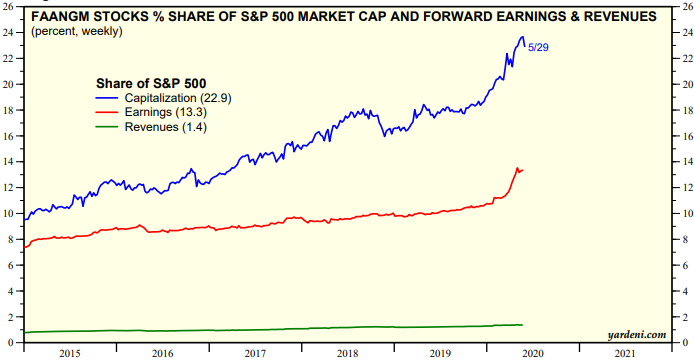
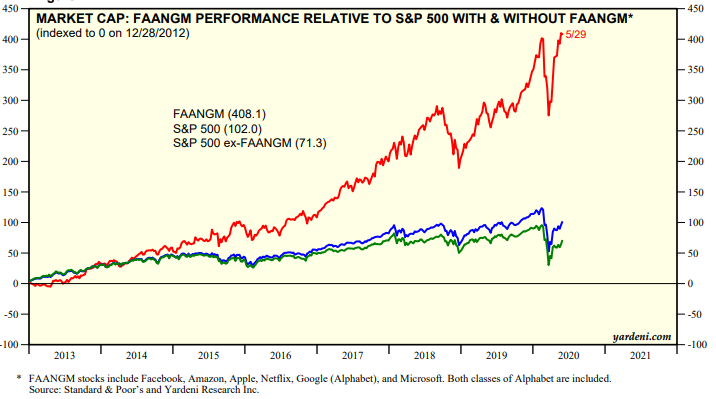
We have therefore a stronger and stronger impact on the S&P500 performance as a whole.
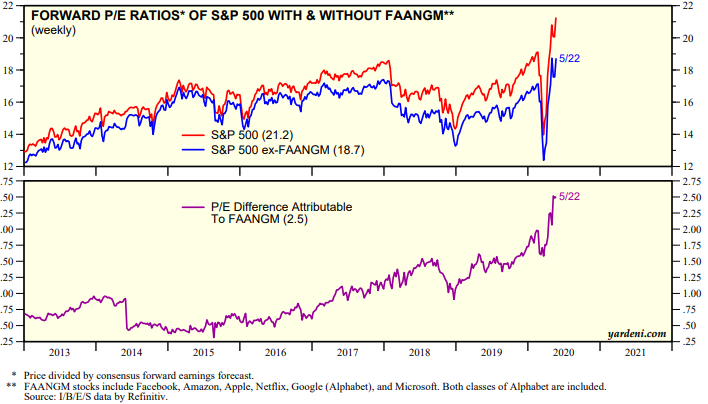
But does that performance impact the valuations? It’s a yes as the P/E ratio of the S&P500 is inflated by 2.5 thanks to the FAANGM.
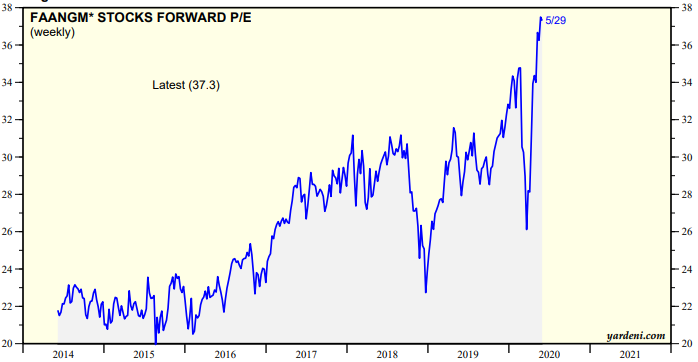
FAANGM stocks are expensive from a P/E ratio perspective. Is the forward growth high now than 5 years ago?
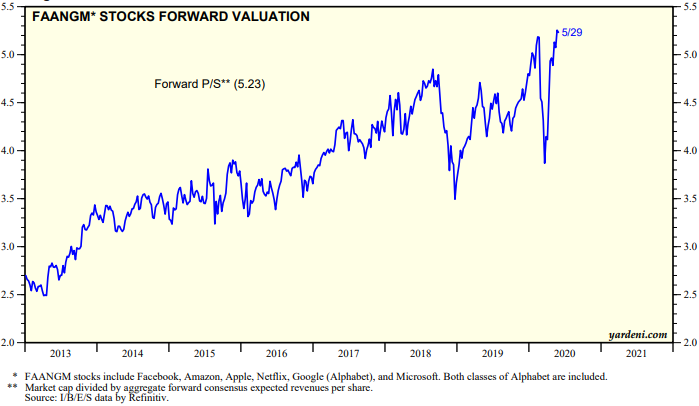
FAANGM were never cheaper when evaluated through the lens of the P/S (Price / Sales) ratio standing above 5x.
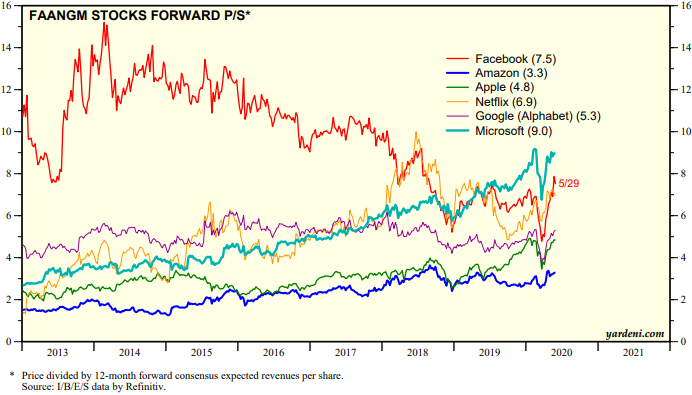
Looking at each stock, most of those are increasing except Facebook. Most of the growth in on Microsoft (P/S at 9x).
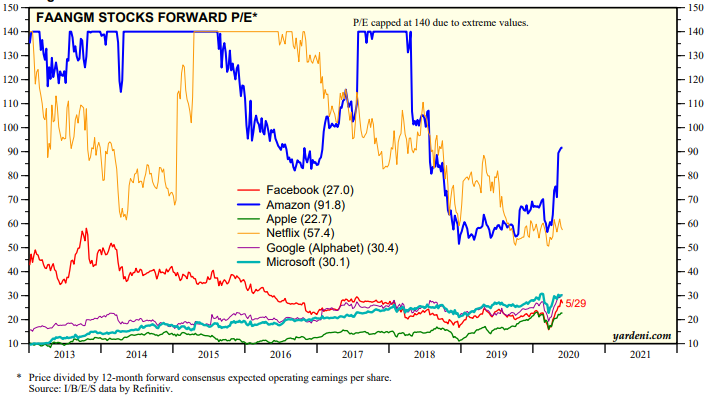
Looking at the P/E ratio we have a similar story. While microsoft traded at 10x earning in 2013, it’s now 30x.
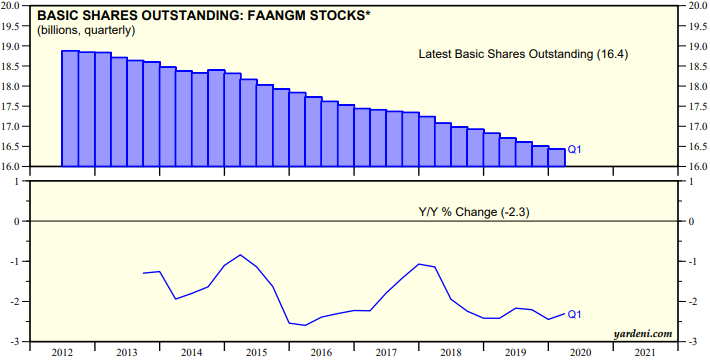
Interestingly, the FAANGM stocks have a good amount of buybacks (around 2% per year). From a flow of funds perspective we can ask ourselves what will happen when the buyback stop.
Another point is that Google, Microsoft and Amazon are in the cloud business. While the margins are currently quite fat, we can expect that it will become a commodity. Nothing that could command a P/S of almost 10x as it seems currently.
Could the FAANGM be the nifty-fifty of the new decade? P/E ratio is around 37x (with a Covid-19 impact), still a long way to go to 50.
Comments are closed.